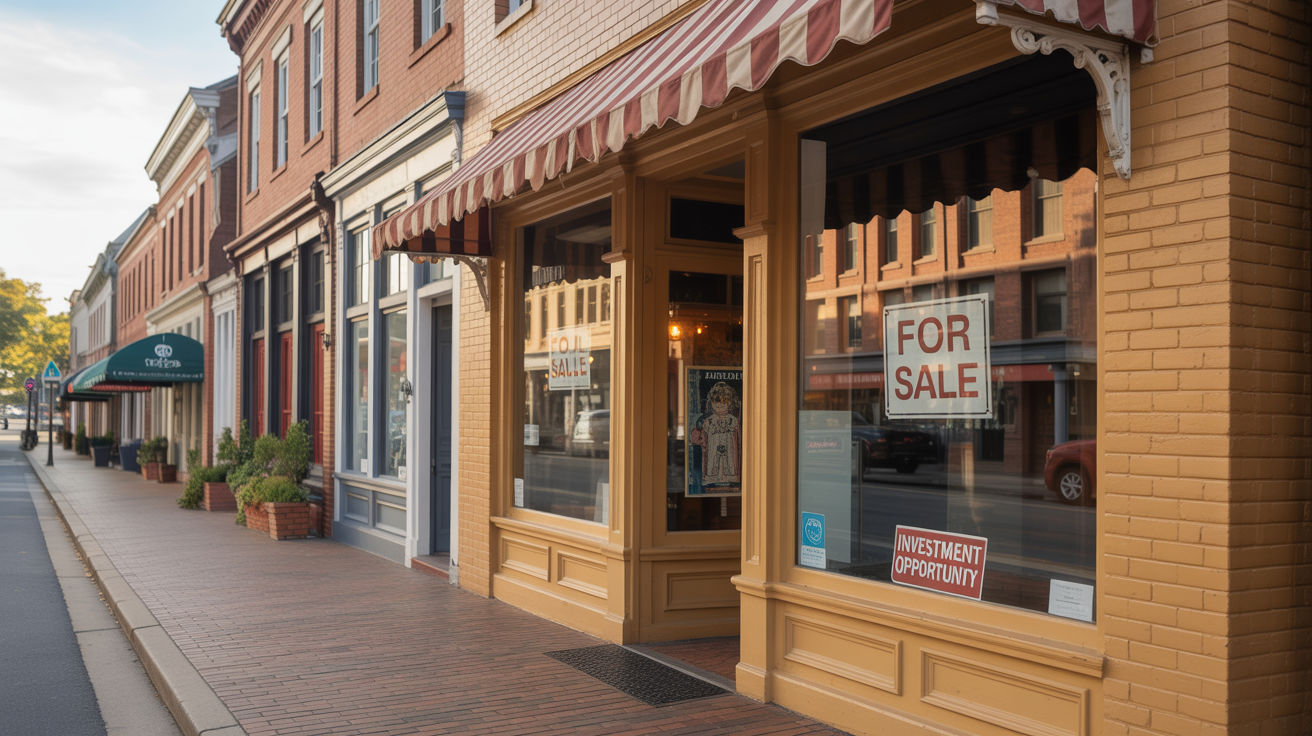
Historic Downtown Norcross at a Glance
While many investors chase flashy markets like Buckhead or Midtown, smart money is quietly flowing into Historic Downtown Norcross. This charming district, just 20 minutes from Atlanta's business core, has emerged as one of Metro Atlanta's most profitable rental investment opportunities—delivering consistent returns that outperform traditional investment metrics.
Market Performance Analysis
5-Year Investment Performance Comparison
Historic Downtown Norcross
Metro Atlanta Average
Norcross Advantage
What's Driving These Superior Returns?
Supply-Demand Imbalance
Historic Downtown Norcross has strict development controls that limit new construction, while demand continues growing from Atlanta commuters seeking affordable alternatives to expensive in-town neighborhoods.
- • Only 12 new rental units added in 2024
- • 340+ households on waiting lists
- • Average tenant search time: 45+ days
Infrastructure Investment Surge
$12.5 million in public infrastructure improvements completed in 2024, including streetscape enhancements, parking expansion, and pedestrian connectivity projects that directly boost property values.
- • New Norcross Station mixed-use development
- • Enhanced MARTA bus connectivity
- • Historic district beautification program
Demographics & Ideal Tenant Profile
Understanding your target tenant base is crucial for maximizing rental success. Historic Downtown Norcross attracts a unique demographic blend that translates to stable, long-term tenancy and willingness to pay premium rents for quality properties.
Primary Tenant Demographics
Income & Stability Metrics
Location Advantages & Amenities
Walkability & Transit Connectivity
Walk Score
Very Walkable - Most errands can be accomplished on foot
Transit Score
Excellent Transit - Many nearby public transportation options
Bike Score
Very Bikeable - Biking is convenient for most trips
Dining & Entertainment
- • 45+ restaurants within walking distance
- • Historic Downtown events calendar (50+ annual events)
- • Thrasher Park amphitheater and recreational facilities
- • Multiple breweries and entertainment venues
- • Weekly farmers market and seasonal festivals
Professional & Educational
- • 20-minute drive to Perimeter Center business district
- • Direct bus routes to major Atlanta employment centers
- • Proximity to Gwinnett Technical College
- • Access to highly-rated Gwinnett County Schools
- • Growing technology and healthcare job base
5-Year ROI Projections
Conservative Investment Scenario Analysis
Sample Property Investment
Projected 5-Year Returns
Risk Assessment & Mitigation
Potential Investment Risks
Market Risks
- • Interest rate fluctuations affecting financing costs
- • Economic downturn reducing rental demand
- • Oversupply if development restrictions change
Operational Risks
- • Tenant turnover and vacancy periods
- • Unexpected maintenance and repair costs
- • Property management challenges
Risk Mitigation Strategies
Ready to Capitalize on Norcross's Growth?
Don't miss out on Historic Downtown Norcross's exceptional investment opportunity. Get a personalized property analysis and discover how we can help you achieve these superior returns with full-service management.
